hyperWind-forecastby Fathom Science
2025 comprehensive verification
52,524 issue times · 910 stations
52,524 issue times · 910 stations
hyperWind-forecast — Comprehensive 2025 Verification
Fathom Science · 52,524 ten-minute issue times · 910 stations · checkpoint epoch 43
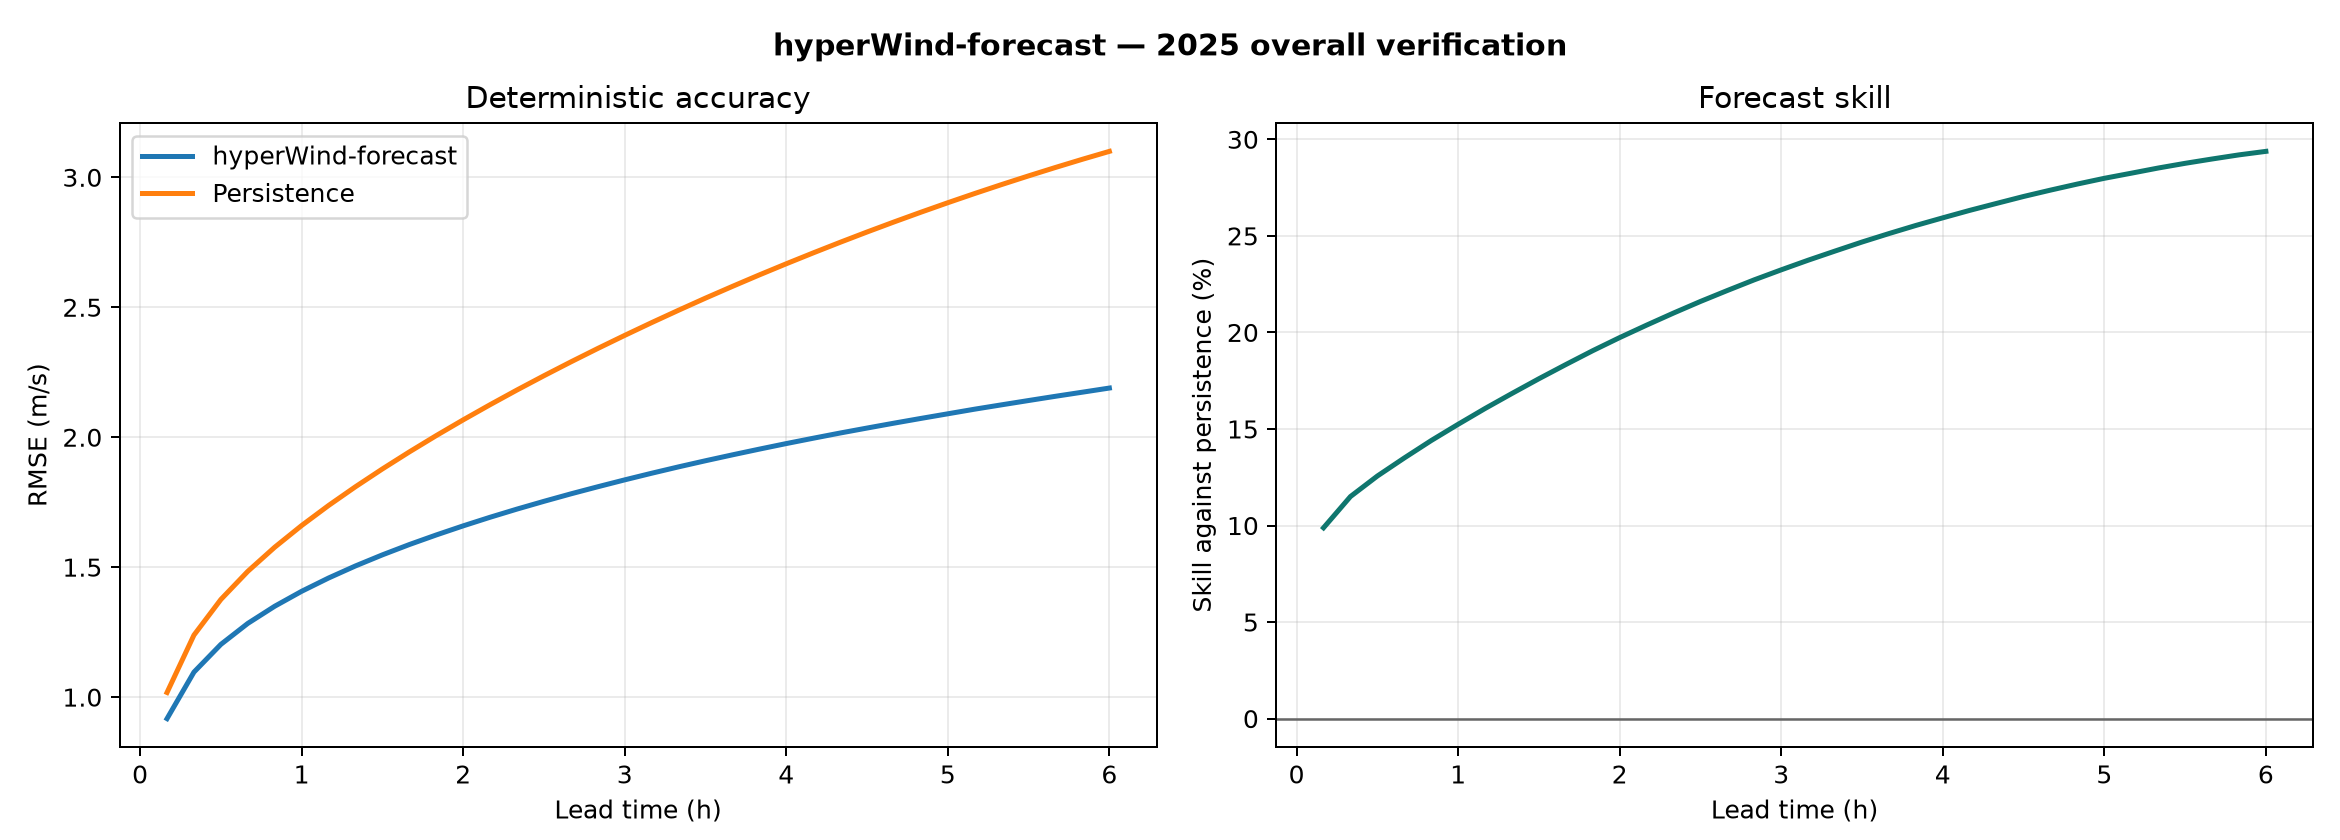
Overall P50 RMSE
1.805 m/s
Skill vs persistence
24.5%
P50 coverage
51.3%
P90 coverage
90.3%
Lead-time verification
| lead_minutes | rmse | persistence_rmse | skill_percent | bias | p50_coverage_percent | p90_coverage_percent | p50_pinball | p90_pinball | sharpness |
|---|---|---|---|---|---|---|---|---|---|
| 10 | 0.917 | 1.018 | 9.882 | -0.037 | 50.936 | 90.143 | 0.315 | 0.159 | 1.080 |
| 60 | 1.407 | 1.660 | 15.243 | -0.068 | 50.818 | 90.160 | 0.495 | 0.249 | 1.731 |
| 180 | 1.836 | 2.392 | 23.243 | -0.110 | 51.299 | 90.336 | 0.650 | 0.335 | 2.343 |
| 360 | 2.189 | 3.100 | 29.377 | -0.178 | 51.542 | 90.292 | 0.775 | 0.411 | 2.868 |
Maximum-gust verification
| window_hours | rmse | persistence_rmse | skill_percent | bias |
|---|---|---|---|---|
| 1.000 | 1.185 | 1.725 | 31.297 | 0.001 |
| 3.000 | 1.543 | 2.721 | 43.285 | -0.003 |
| 6.000 | 1.894 | 3.677 | 48.500 | -0.036 |
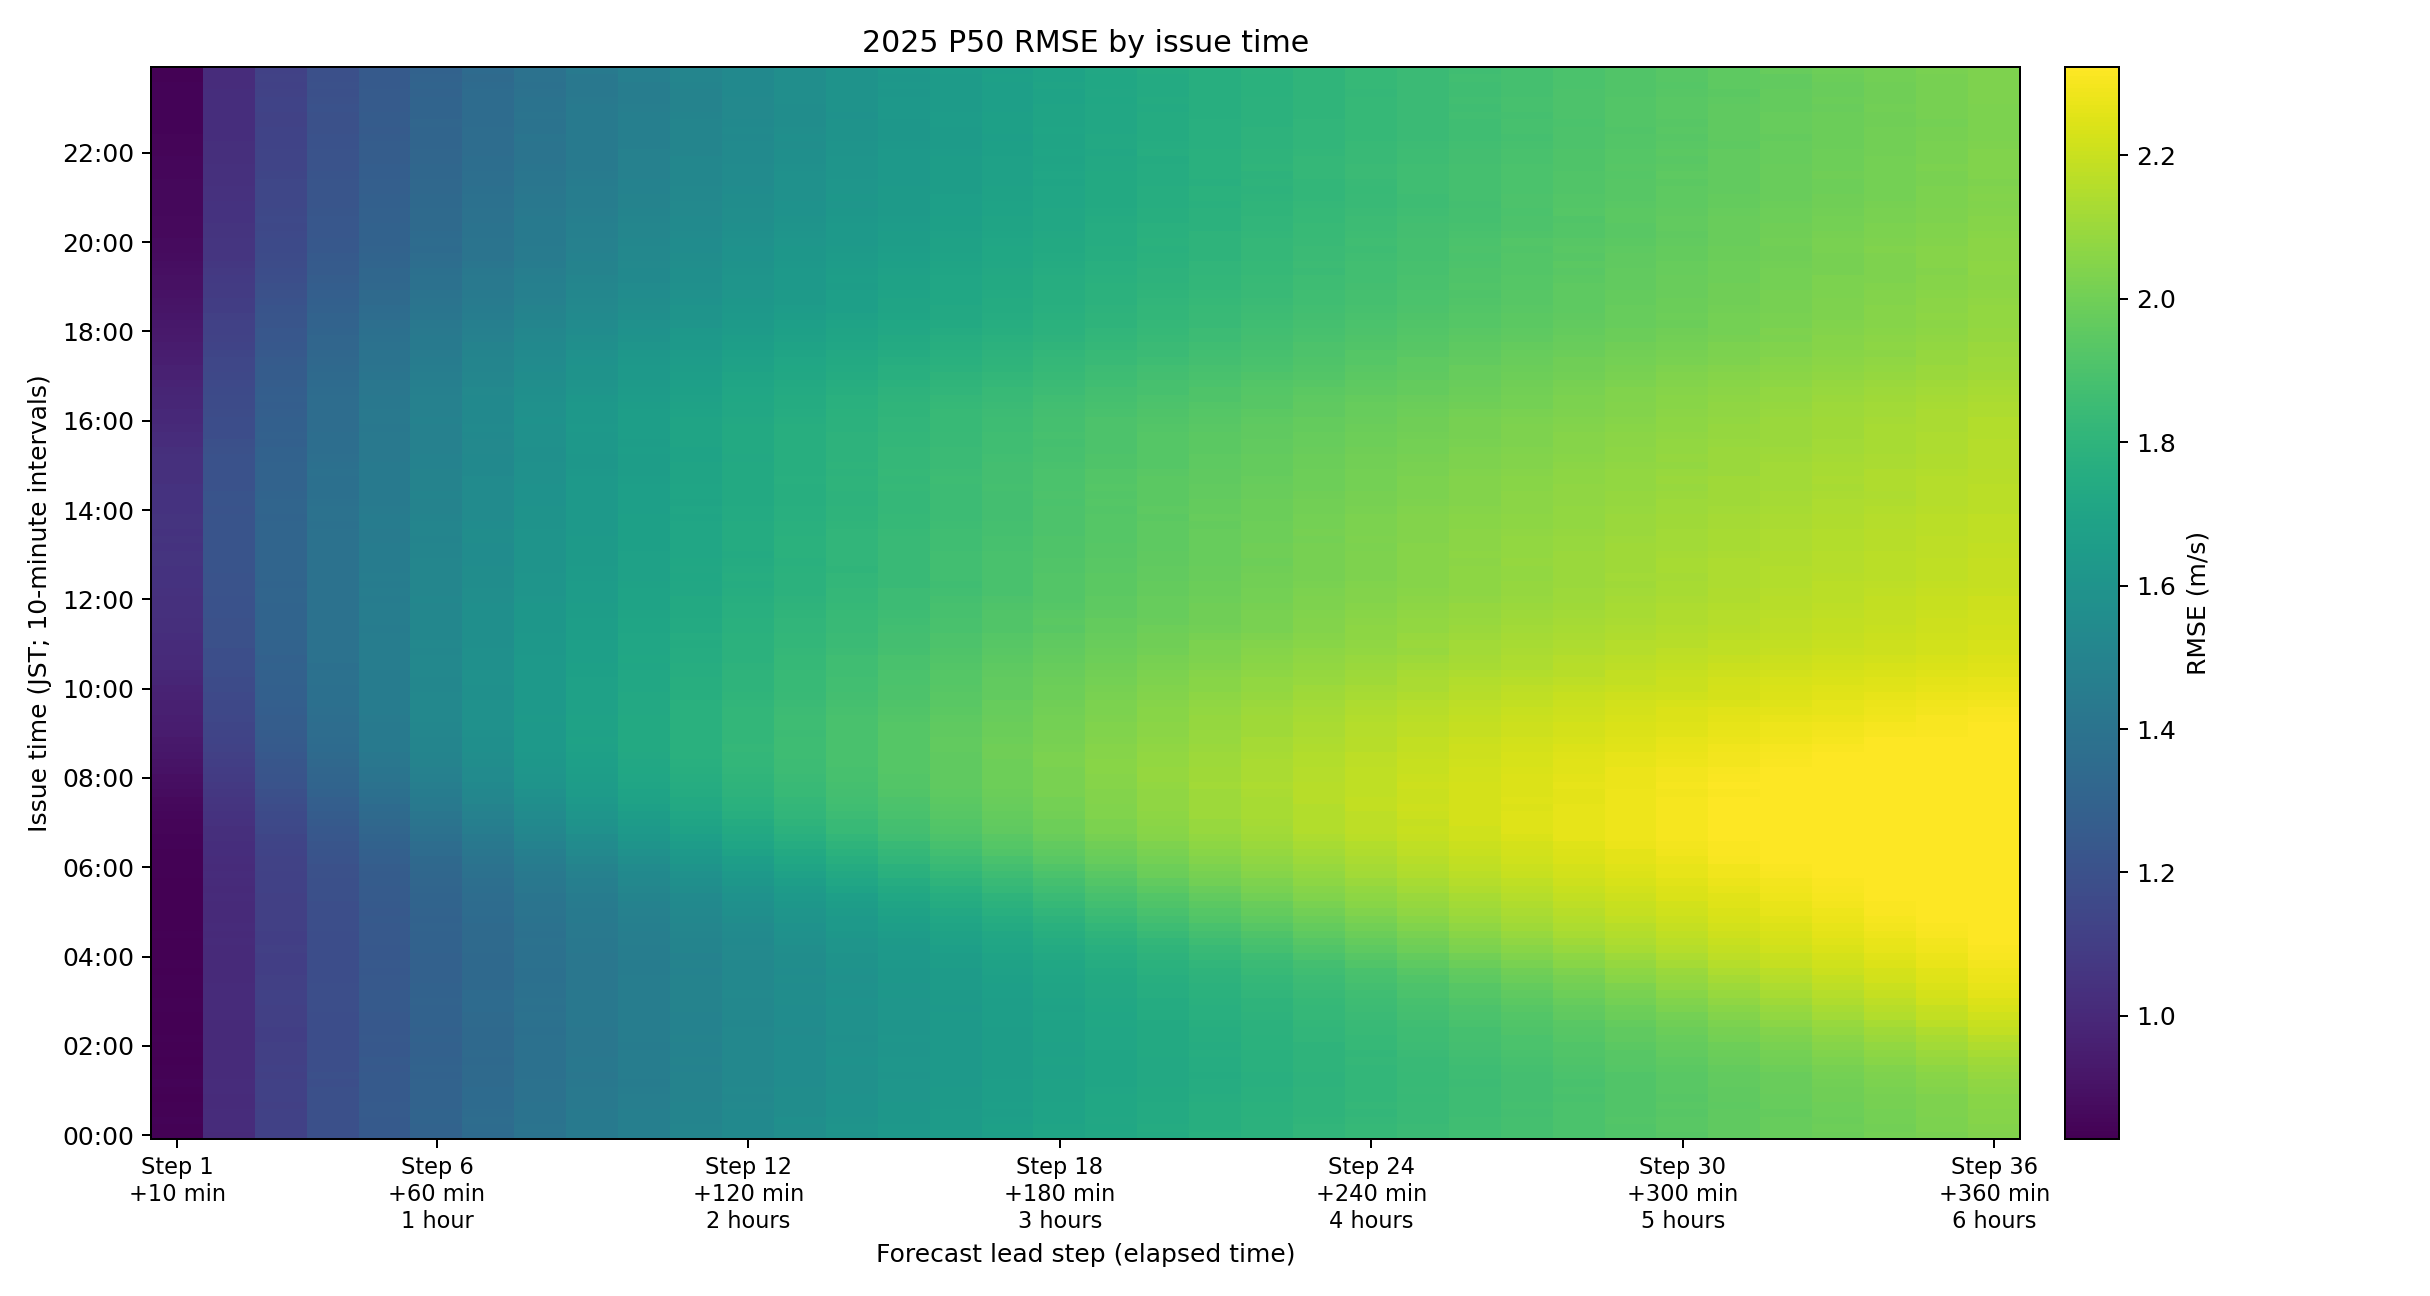
By issue time: darker colors indicate lower error. RMSE increases with forecast lead and is highest for long-range forecasts issued during the morning.
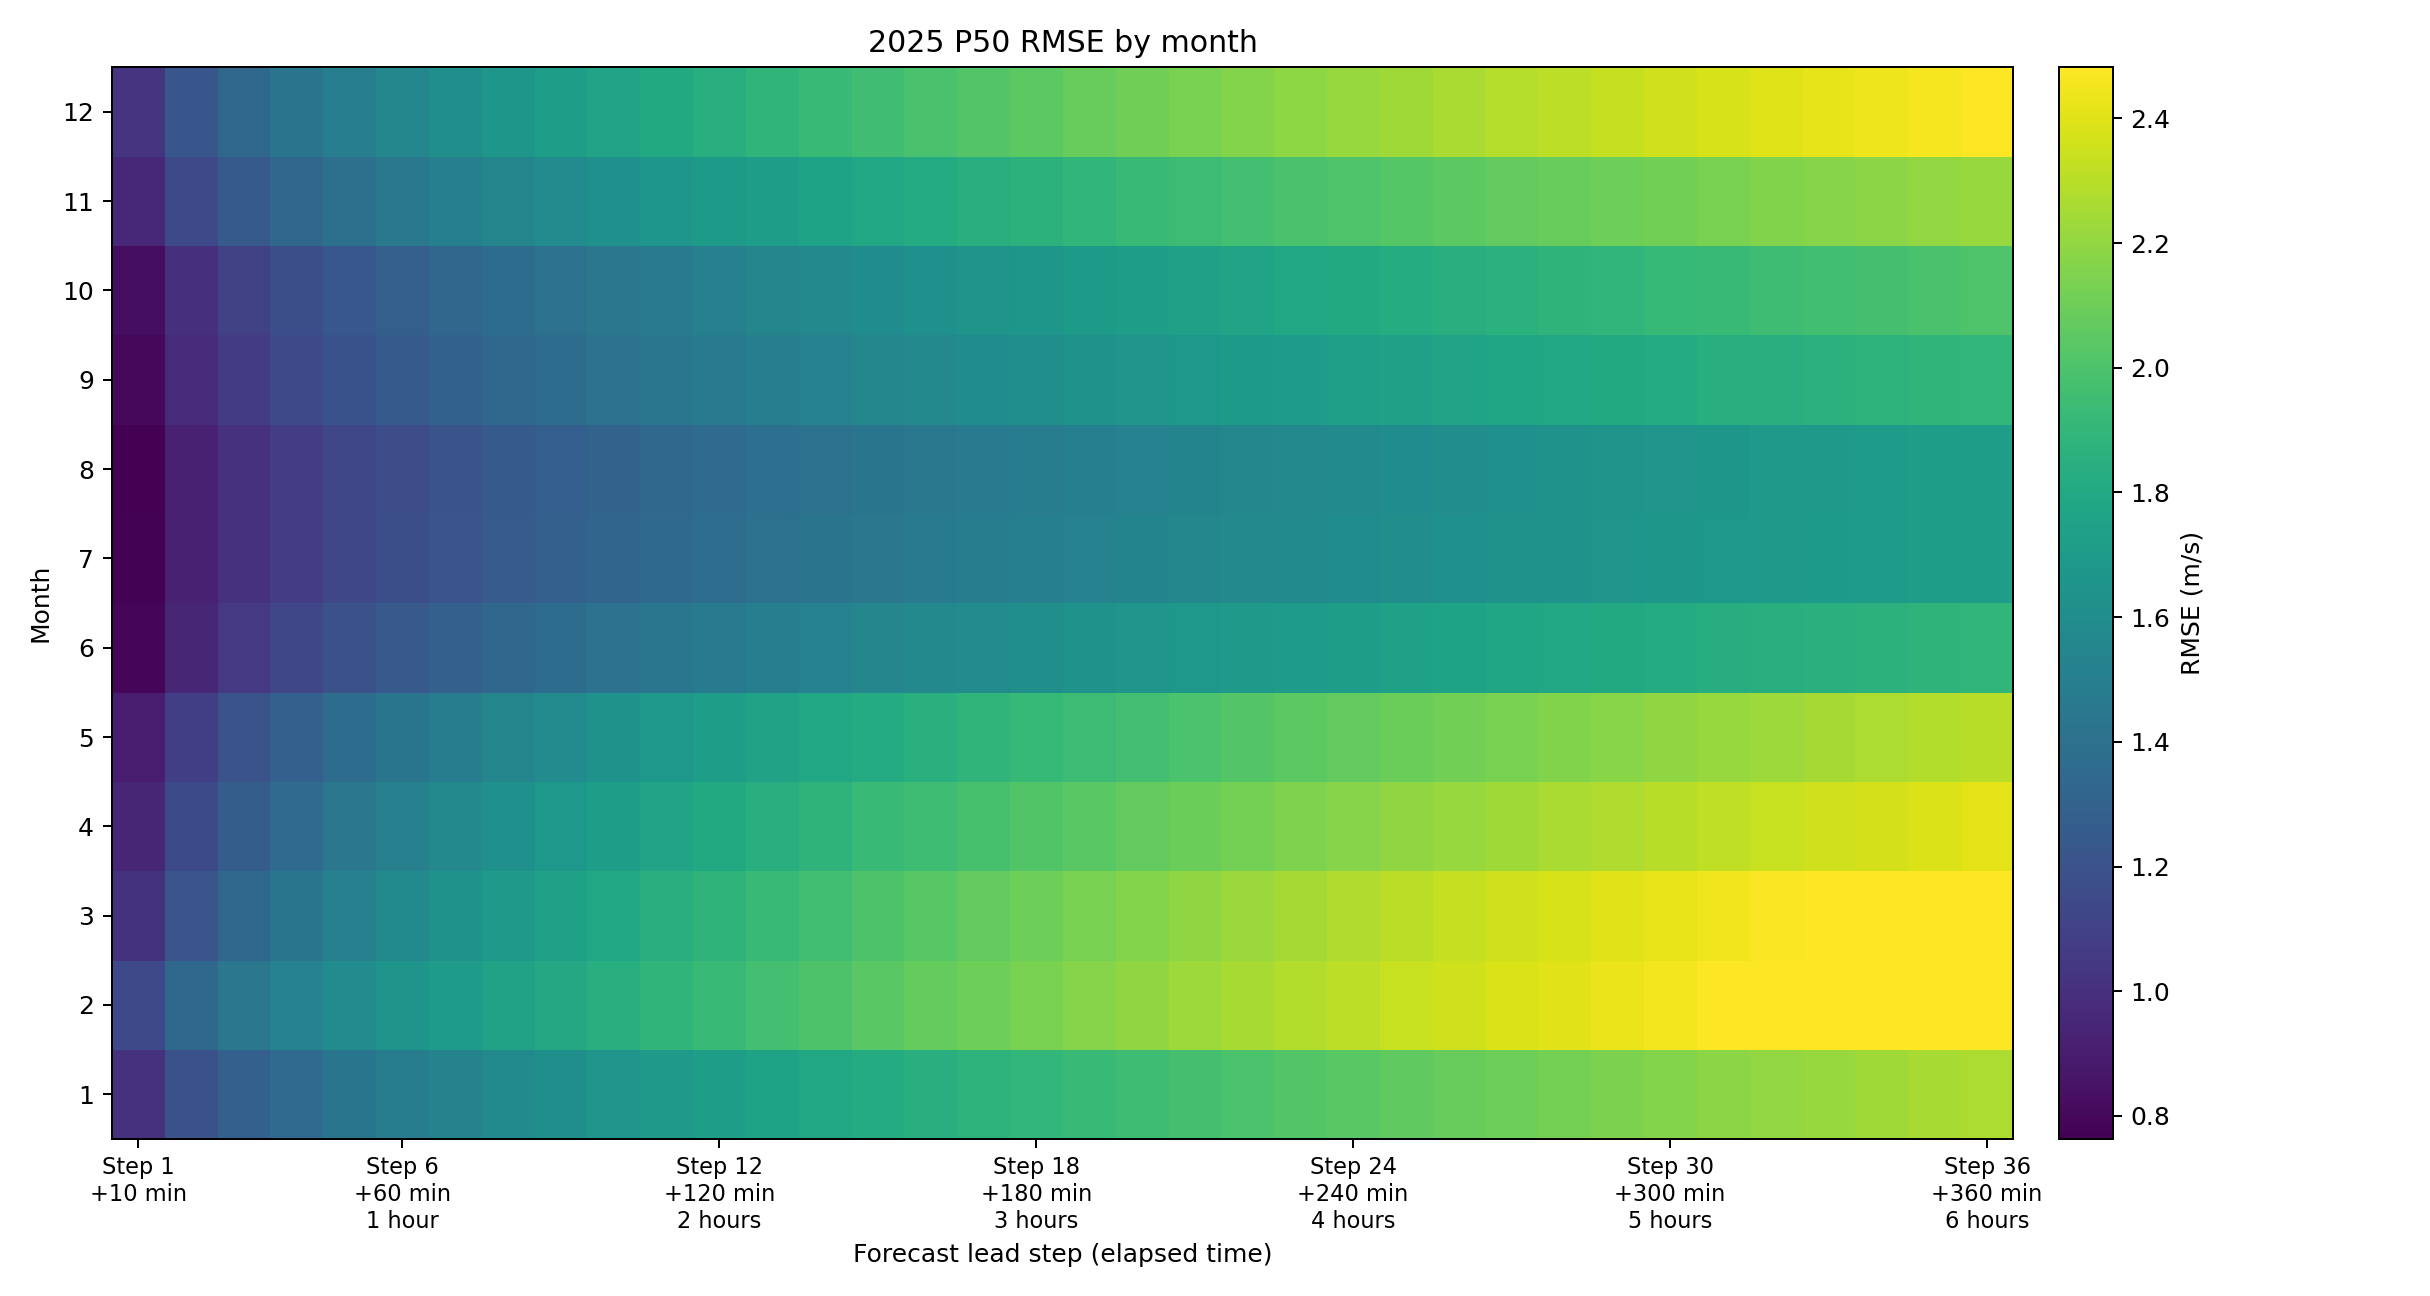
By month: RMSE increases with forecast lead. Long-range errors are generally higher in winter and spring and lower during parts of summer.
Direct maximum-event classification
| window_hours | threshold_ms | hits | misses | false_alarms | correct_negatives | pod | far | csi | f1 |
|---|---|---|---|---|---|---|---|---|---|
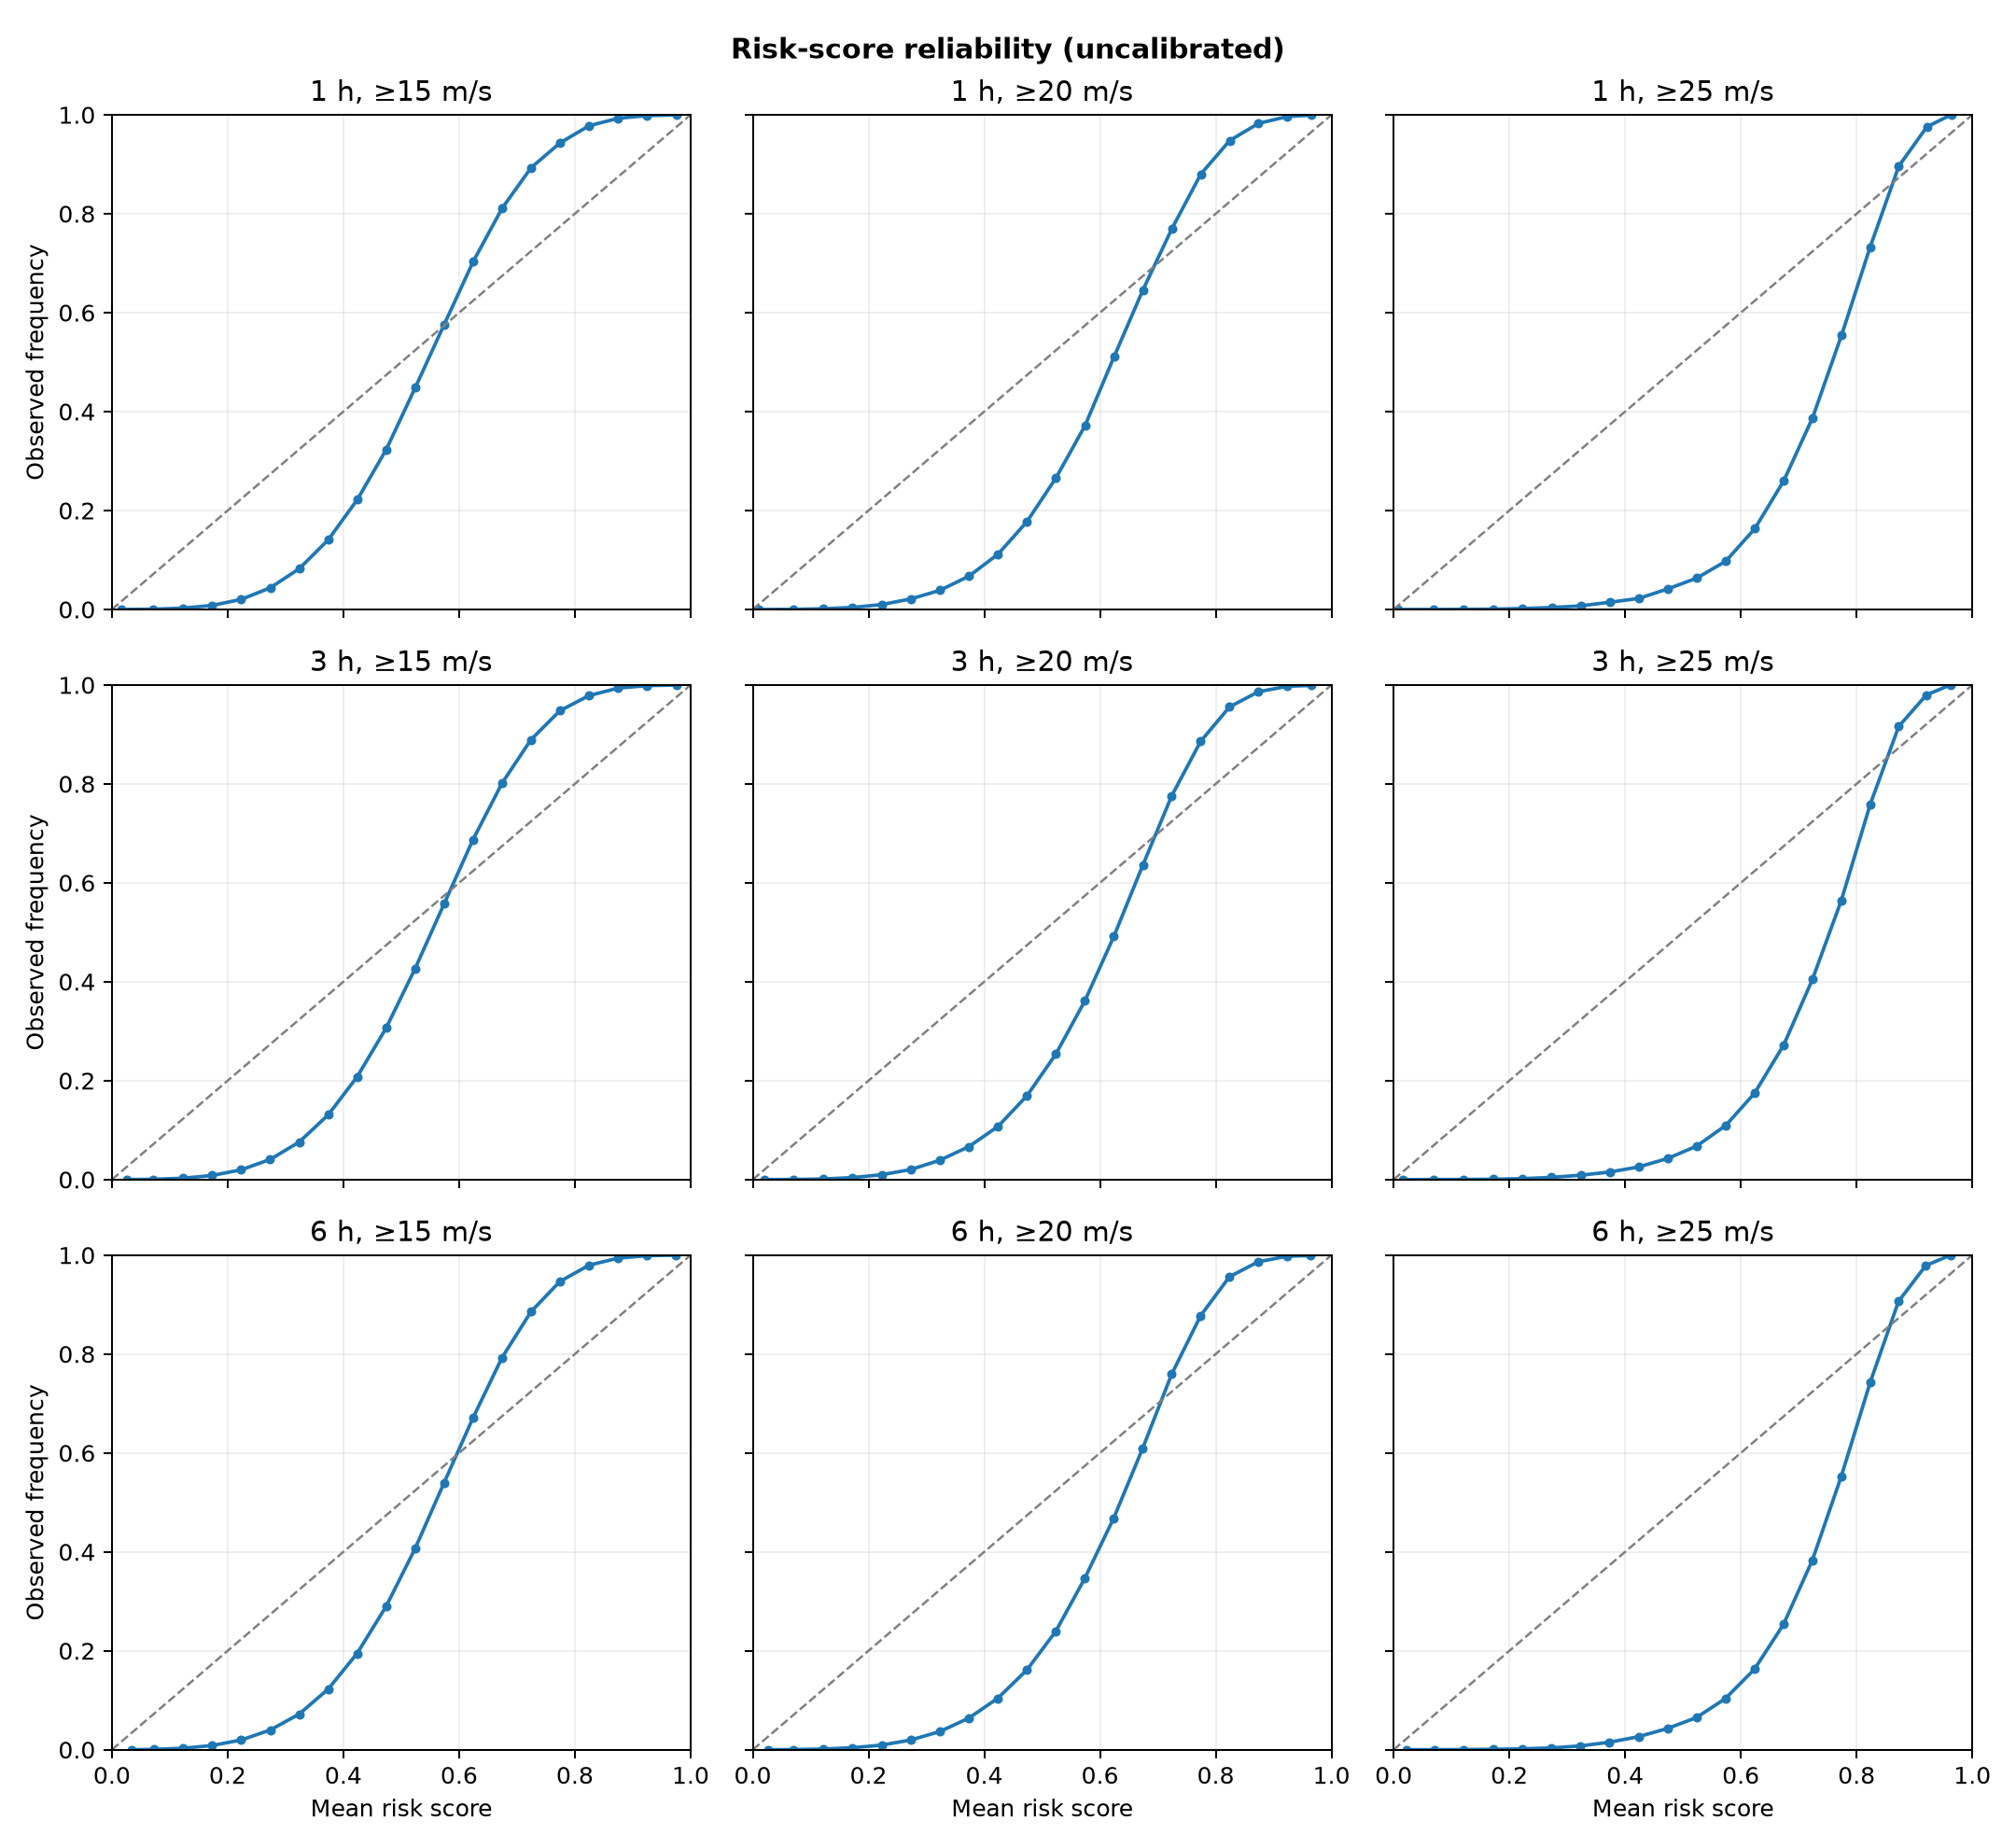
| 1.000 | 15.000 | 631049.000 | 306583.000 | 140938.000 | 46541024.000 | 0.673 | 0.183 | 0.585 | 0.738 |
| 1.000 | 20.000 | 73204.000 | 55223.000 | 18414.000 | 47472753.000 | 0.570 | 0.201 | 0.499 | 0.665 |
| 1.000 | 25.000 | 7007.000 | 7162.000 | 2196.000 | 47603229.000 | 0.495 | 0.239 | 0.428 | 0.600 |
| 3.000 | 15.000 | 882886.000 | 566620.000 | 227053.000 | 45835794.000 | 0.609 | 0.205 | 0.527 | 0.690 |
| 3.000 | 20.000 | 104078.000 | 112777.000 | 30195.000 | 47265303.000 | 0.480 | 0.225 | 0.421 | 0.593 |
| 3.000 | 25.000 | 9714.000 | 15987.000 | 3497.000 | 47483155.000 | 0.378 | 0.265 | 0.333 | 0.499 |
| 6.000 | 15.000 | 1083608.000 | 928199.000 | 321779.000 | 45033510.000 | 0.539 | 0.229 | 0.464 | 0.634 |
| 6.000 | 20.000 | 126086.000 | 194534.000 | 43158.000 | 47003318.000 | 0.393 | 0.255 | 0.347 | 0.515 |
| 6.000 | 25.000 | 11546.000 | 28821.000 | 4816.000 | 47321913.000 | 0.286 | 0.294 | 0.256 | 0.407 |
Metrics guide
Every metric compares the model or baseline with observations. Select a ? in any table header for a quick explanation.